Deer, Elk, Bison Population Dynamics Research Methods Wildlife Management
by admin
Comments Off
The Art and Science of Counting Deer
Charles E. Kay. 2010. The Art and Science of Counting Deer. Muley Crazy Magazine, March/April 2010, Vol 10(2):11-18
Full text:
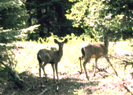
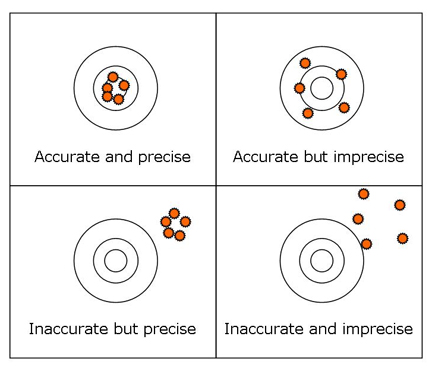
It is the simplest of questions and upon which all management is based. It is also the first thing most hunters want to know. How many deer are there? The answer? Well, there are no answers, only estimates. In addition, one needs to understand the difference between precision and accuracy. Think of precision as shooting a five-shot, half-inch group at 100 yards, but the group is 20 inches high and to the right. The shots have been very precise, almost in the same hole, but they were not accurate because they were far from the center of the target. Accuracy is hitting the bullseye. So, an estimate can be precise without being accurate. Estimates that are both precise, low variation, and accurate, close to the true number, are very difficult and very expensive to obtain. Moreover, all population estimates contain assumptions, as well as sampling errors and statistical variation.
Since the advent of modern game management, various methods have been developed to count wildlife. Entire books have been written on the subject and there are enough scientific studies to fill a small library. Here, I will discuss only the techniques that have been, or are commonly used to estimate the number of mule deer and elk on western ranges. This includes ground counts, aerial surveys, population models, pellet-group counts, and thermal imaging.
The oldest and simplest method is ground counts. As the name implies, these are simply counts conducted on foot, horseback, or from vehicles by either one or more observers. While relatively inexpensive, this method is neither precise nor accurate. There is the problem of double counting when the deer run over the hill into the next canyon that has not yet been surveyed and under counting when animals are hidden from view by vegetation or topography. Today, ground counts are seldom used to estimate herd numbers but they are still commonly employed to estimate fawn:doe ratios or buck:doe ratios under the assumption that doe, fawn, and buck sighting rates are similar, which they are not. If bucks are more difficult to see than does because of the habitat the males occupy, or their behavior, ground counts will underestimate the number of bucks.
Due to the shortcomings of ground counts, wildlife biologist were quick to take to the air, first in airplanes and later in rotary aircraft. To make a long story short, counts from helicopters are more accurate than population surveys from fixed-wings. Any aerial count, though, is subject to errors, because even from the air you do not see all members of a population, be they mule deer or elk. This is what, in the scientific literature, is known as sightability bias. Even in experiments where livestock have been placed in flat, grassy pastures, aerial observers fail to record all the animals.
Deer, Elk, Bison Research Methods Wildlife Habitat Wildlife Management
by admin
Comments Off
Range Reference Areas and The Condition of Shrubs on Mule Deer Winter Ranges
Charles E. Kay. 2009. Range Reference Areas and The Condition of Shrubs on Mule Deer Winter Ranges. Muley Crazy Magazine. Vol 8(1):35-40.
Dr. Charles E. Kay, Ph.D. Wildlife Ecology, Utah State University, is the author/editor of Wilderness and Political Ecology: Aboriginal Influences and the Original State of Nature [here], author of Are Lightning Fires Unnatural? A Comparison of Aboriginal and Lightning Ignition Rates in the United States [here], co-author of Native American influences on the development of forest ecosystems [here], and numerous other scientific papers.
Full text:
After predator control, range management is the key to maintaining healthy populations of mule deer and other wildlife. It is not just habitat, but the condition of that habitat. For instance, how do you tell if a range is being overgrazed? One way is to establish what are called range reference areas. There are a few places that have never been grazed by livestock, such as steep-sided mesa tops, where the vegetation can be compared with nearby grazed areas. Unfortunately, there are very few places in the West that have never been grazed by livestock and there are even fewer that deer and elk cannot reach. So in most areas it is necessary for managers to create their own range reference areas by building exclosures, which they have been doing for years.
If you are working in a national park or on a winter range where livestock use is prohibited, it is a relatively simple matter to build an 8-foot tall fence around a representative plant community, such as willows, aspen, grasslands, or upland shrubs. Then by measuring the vegetation inside and outside the exclosure on permanent sampling plots over time, you can determine what, if any, impacts wildlife are having on the range. It is also important to establish permanent photopoints when the exclosure is first erected.
If on the other hand, you are working on BLM or Forest Service lands that are grazed by livestock and wildlife, the design of the exclosure is a little more complicated. One part, termed the total-exclusion plot, is still high-game fenced to exclude both livestock and wildlife, while an adjacent area, called the livestock-exclusion plot, is fenced in such a manner that livestock are excluded but mule deer and/or elk can jump the low fence and graze/browse by themselves — please see the accompanying photo. Unfenced adjoining areas are grazed by both livestock and wildlife. Thus by measuring the vegetation in all three areas — total exclusion, livestock-exclusion wildlife-only use, and joint use — you can determine, what vegetation changes, if any, are being caused by wildlife separately from those caused by livestock. The total-exclusion portion of the exclosure can also be used to tell if climatic variation, disease, or insects are causing certain plants to decline.
As you might have guessed, the latter type of range reference area is called a three-part exclosure because vegetation conditions are measured under three different grazing treatments. During the 1950’s and 1960’s when mule deer populations were at all time highs, a series of three-part exclosures were built on BLM and Forest Service allotments throughout the West. Unfortunately the Federal land management agencies have no nation-wide program to maintain those exclosures and many have fallen into disrepair, which is extremely shortsighted. Because without long-term range reference areas there is no way to determine what is happening on our public lands.
Deer, Elk, Bison Research Methods Wildlife Management Wildlife Policy
by admin
leave a comment
Caribou Numbers in the NWT — The Outfitter’s Battle
John Andre. 2007. Caribou Numbers in the NWT — The Outfitter’s Battle (PowerPoint presentation). Shoshone Wilderness Adventures, Lac de Gras, Northwest Territories, CA.
John Andre is majority stockholder in two Canadian corporations, Qaivvik, Ltd. and Caribou Pass Outfitters, Ltd.
Full PowerPoint presentation [here] (2.44MB)
Selected excerpts:
The caribou have been hunted for tens of thousands of years by the aboriginal peoples of the north. The health of the caribou herds is sacred to them, it is part of their very being. Generation after generation followed the caribou, or waited for them to come. They understood the movements of the great herds, and the cycle of feast and famine. Now, with “modern” technology, we track caribou with satellite collars, count nematodes in their droppings, and census them using fancy terms such as linear regression analysis and coefficient of variation. It is not an easy job, counting over a million animals, scattered over tens of thousands of square miles of wilderness. This presentation is not meant to degrade, in any way, the efforts of some of the wildlife biologists that have worked hard over the last 60 years, risking their lives in an unforgiving environment, with limited budgets and manpower, to study and better understand the caribou.
The Problems Begin
In late 2005, the government split the former RWED into ENR (Environment & Natural Resources) and ITI (Industry, Tourism, and Investment.) It may or may not be a coincidence, but this is when problems with the government began.
In May of 2006, we were abruptly told that we had to stop selling caribou hunts for that year; that the caribou numbers had dropped significantly. This cost the industry three months of sales, and hundreds of thousands of dollars. The question is, if the next survey hadn’t been done yet, how did the government know for sure the herds were down? Was the outcome preconceived?
In June of 2006, the Bathurst herd was surveyed, and was down to 128,000 caribou. Minister Miltenberger, of the ENR , told the outfitting industry that they were cutting our tag quotas back to the pre-2000 level of 132 tags, for the 2007 season. At the same time, resident hunters were reduced from 5 tags to 2 tags, and bulls only. (The harvest of mature bulls has consistently been shown to have zero effect on overall ungulate population growth.) The outfitting industry, although not necessarily agreeing with their numbers or science, wanted to do their part to help the caribou, and so we accepted this slashing of our industry by nearly 30%.
The fact is, we hadn’t looked at the numbers carefully enough.
Variation In Mitochondrial DNA and Microsatellite DNA in Caribou (Rangifer Tarandus) in North America
Matthew A. Cronin, Michael D. Macneil, and John C. Patton. 2005. Variation In Mitochondrial DNA and Microsatellite DNA in Caribou (Rangifer Tarandus) in North America. Journal of Mammalogy, 86(3):495–505, 2005.
Full text [here]
Selected excerpts:
ABSTRACT
Genetic variation of caribou (Rangifer tarandus) at 18 microsatellite DNA loci and the cytochrome-b gene of mitochondrial DNA (mtDNA) was quantified in 11 herds of 3 North American subspecies: Alaskan barren ground caribou (R. t. granti), Canadian barren ground caribou (R. t. groenlandicus), and woodland caribou (R. t. caribou). Phylogenetic analysis of 1,194 nucleotides of cytochrome-b sequence resulted in a clade of 52 genotypes in R. t. granti, R. t. groenlandicus, and in 1 herd of R. t. caribou, and a clade of 7 genotypes in R. t. caribou. mtDNA sequence divergence is approximately 1% between these clades and 0.3–0.6% within these clades. The subspecies do not have monophyletic mtDNA, but do have different frequencies of mtDNA genotypes. Microsatellite allele frequencies also are differentiated between the woodland (R. t. caribou) and barren ground (R. t. granti and R. t. groenlandicus) subspecies. An exception is the George River herd in Labrador, which is classified as R. t. caribou but has mtDNA and microsatellite allele frequencies intermediate between the other herds of R. t. caribou and R. t. groenlandicus. Within subspecies, there is relatively low differentiation of microsatellite allele frequencies and mtDNA genotypes among herds of R. t. granti and R. t. groenlandicus, and relatively high differentiation of microsatellite alleles and mtDNA genotypes among herds of R. t. caribou in 4 geographically separate areas in Canada. The extent of differentiation of mtDNA genotype frequencies and microsatellite allele frequencies within and among each subspecies reflects past and present gene flow among herds. Issues related to subspecies, populations, ecotypes, and herds are discussed.
more »