Regarding Thermodynamics and Heat Transfer
Chuck Wiese (2011) Regarding Thermodynamics and Heat Transfer. Weatherwise Inc. Portland, Oregon.
Full text [here]
Selected excerpts:
(Why Al Gore’s Comments to Bill O’Reilly at Fox News Are Wrong)
From a meteorologist’s perspective, nothing is worse than to see atmospheric science trashed by the likes of Al Gore, who is a self proclaimed expert in this area, but has had no formal training from any accredited university and constantly makes incorrect and unprovable assertions about “human caused” climate change.
The latest revelation came on February 2, 2011, when Mr. Gore eagerly answered a questioning of the accuracy of Gore’s past claims about climate from Bill O’Reilly from the Fox News Channel since much of the central and east coast of the US have had a cold and snowy winter. Gore told O’Reilly that the snowstorms of this winter were part of the pattern of changing climate expected by scientists and result from the warming earth air masses with more moisture were running into a patch of cold air. Gore claimed: “ These warmer air masses ( which Gore claims result from human carbon emissions that create atmospheric CO2 ) act like a sponge to moisture and soak it up until they hit a patch of cold air.” Gore then claims that this “extra moisture” contained in the warmer air causes more intense precipitation and thus heavier snowfall, and is all consistent with a warming earth.
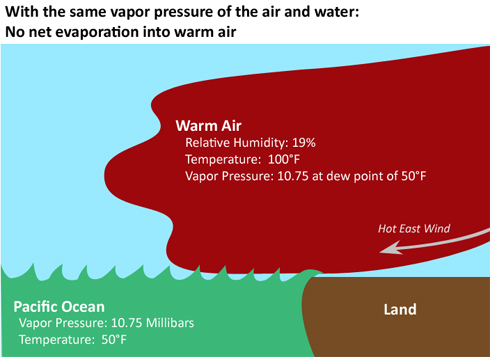
These statements by Gore are sheer nonsense. While it is true that warmer air can hold more moisture than cold air, the temperature of the air has nothing to do with how much water vapor will ultimately be evaporated ( or as Gore puts it “soaked up” ) into it. That is determined solely by what is called the vapor pressure gradient that exists between a sample of air that may overlie a surface of water. …
Large Variations in Southern Hemisphere Biomass Burning During the Last 650 Years
Z. Wang, J. Chappellaz, K. Park, and J. E. Mak. 2010. Large Variations in Southern Hemisphere Biomass Burning During the Last 650 Years. Science Express 2 December 2010.
Full text [here]
Selected excerpts:
Abstract
We present a 650-year Antarctic ice core record of concentration and isotopic ratios (d13C and d18O) of atmospheric carbon monoxide. Concentrations decreased by ~25% (14 ppbv) from mid-1300s to the 1600s, then recovered completely by the late 1800s. d13C and d18O decreased by about 2% and 4% respectively from the mid-1300s to the 1600s, then increased by about 2.5% and 4% by the late 1800s. These observations and isotope mass balance model results imply that large variations in the degree of biomass burning in the Southern Hemisphere occurred during the last 650 years, with a decrease by about 50% in the 1600s, an increase of about 100% by the late 1800s, and another decrease by about 70% from the late 1800s to present day.
… The main sources of atmospheric CO include atmospheric oxidation of methane and non-methane hydrocarbons (NMHC), biomass burning, and fossil fuel combustion (4). These sources account for about 90% of today’s global CO budget (4). Stable isotopic ratios (d13C and d18O) in atmospheric CO help to resolve the relative contributions of these sources and thus to better estimate the global CO budget (5). To date, no isotopic ratios from CO in ice have been reported and few CO mixing ratio measurements have been reported (1, 3, 6). Using a recently developed analytical technique (7), we present measurements of CO concentration ([CO]), d13C, and d18O from a South Pole ice core… and from the D47 ice core… in Antarctica (Fig. 1). …
The contribution from fossil fuel combustion is negligible prior to the 1900s based on historic CO2 emissions from fossil fuel combustion (10). In addition, simulations from the Model for Ozone and Related chemical Tracers (MOZART-4) (see Supporting Online Material, SOM) shows the fossil fuel combustion contribution to today’s CO budget in Antarctica is only 2-3 ppbv. Thus the main sources of CO able to explain our signals are biomass burning and NMHC oxidation. …
We can use isotopic compositions to help distinguish combustion-derived CO (e.g., biomass burning) from non-combustion derived CO (e.g., hydrocarbon oxidation). C18O is a useful tracer for this because of large differences in the oxygen isotopic composition between combustion and noncombustion sources of CO (11). The d18O signature from combustion sources is significantly enriched compared to the d18O signature from hydrocarbon oxidation processes (11-12). d18O value for biomass burning derived CO is generally between 15% and 22%, depending on specific combustion conditions (12–14). …
CO from NMHC oxidation did not change significantly, whereas CO from biomass burning showed a large “saddle” trend, with maxima in both the mid-1300s and the late 1800s and a minimum in the 1600s. The observed trend in [CO], d13C and d18O was therefore mostly driven by variations in biomass burning, and compared to present day, biomass burning was almost the same in the late 1800s as that in the mid-1300s. …
Previous modeling studies suggest that preindustrial biomass burning was much lower than today, with a reduction of up to 90% (35–37). This is the common assumption in climate model simulations. However, our results show that present day CO from Southern Hemisphere biomass burning is lower than at any other time during the last 650 years. This is particularly relevant since assumptions on preindustrial [CO] are an important component for correctly estimating the radiative forcing of tropospheric ozone in preindustrial times (38). [CO] changes due to biomass burning also suggest that there were decadal and centennial scale variations in average concentrations of black carbon, another major atmospheric constituent produced with burning, leading to the unanswered question of its potential role in long term climate variability.
Changes in Snowfall in the Southern Sierra Nevada of California Since 1916
John R. Christy and Justin J. Hnilo. 2010. Changes in Snowfall in the Southern Sierra Nevada of California Since 1916. Energy & Environment, Vol. 21, No. 3, 2010
Full text [here]
Selected excerpts:
Abstract
A time series (1916–2009) of annual snowfall totals for Huntington Lake (HL, elev. 2141 m) in the southern Sierra Nevada of California is reconstructed. A reconstruction is (a) necessary because HL data after 1972 are mostly missing and (b) possible because nearby stations reveal high correlations with HL, two above 0.90. The results show mean annual snowfall in HL is 624 cm with an insignificant trend of +0.5 cm (+0.08%) ±13.1 cm per decade. Similar positive but insignificant trends for spring snowfall were also calculated. Annual stream flow and precipitation trends for the region again were insignificantly positive for the same period. Snow-water-equivalent comparisons, measured on 1 Apr since 1930 at 26 sites and since 1950 at 45, show similar small, mostly positive, and insignificant trends. These results combined with published temperature time series, which also reveal no significant trends, form a consistent picture of no remarkable long-term changes in the snowfall of this area and elevation of the southern Sierra Nevada of California since the early 20th century.
Conclusion
With the available data from six mid-elevation stations in the Southern Sierra region of California we reconstructed annual snowfall totals for 36 missing years of the Huntington Lake record to complete the time series (1916–2009). The standard error of the missing years is calculated to be ±36 cm, or 6% of the 94-year annual mean of 624 cm in the most robust estimation method (though we utilized the average of six methods which reduces the standard error further.)
The results of both the annual and spring snowfall time series indicate no remarkable changes for the 1916–2009 period in the basins drained by the Merced, San Joaquin, Kings and Kaweah Rivers. In the six reconstructions the range of trend results varied only slightly from -0.3% to +0.6% per decade. With a consensus trend of only +0.5 cm (+0.08%) per decade ±13.1 cm per decade there is high confidence in the “no-significant-trend” result. The corroborating information on temperature trends (Christy et al. 2006), stream flow, precipitation and shorter period snow water equivalent trends presented here are consistent with “no-significant-trend” in So. Sierra snowfall near 2000m elevation since 1916.
The statistical properties of annual snowfall, and associated annual variables mentioned above, demonstrate the high level of variability in western precipitation. For example, calculating trends over short periods, such as in 25-year segments, produces a wide range of trends as low as -83.0 to +82.8 cm per decade with a median of +10.2 cm per decade and a most recent (1985–2009) value of +15.9 (+2.6%) cm per decade. This suggests that the impacts of interannual and interdecadal variations are to be considered of serious import in comparison with impacts of long-term trends which have been shown to be negligible in this region to this point. …
Empirical Evidence for a Celestial Origin of the Climate Oscillations and Its Implications
Nicola Scafetta. 2010. Empirical Evidence for a Celestial Origin of the Climate Oscillations and Its Implications. Journal of Atmospheric and Solar-Terrestrial Physics(2010),doi:10.1016/j.jastp.2010.04.01
Full text [here]
Selected excerpts:
Abstract
We investigate whether or not the decadal and multi-decadal climateoscillations have an astronomical origin. Several global surface temperature records since 1850 and records deduced from the orbits of the planets present very similar power spectra. Eleven frequencies with period between 5 and 100 years closely correspond in the two records. Among them, large climate oscillations with peak-to-trough amplitude of about 0.1 and 0.25ºC, and periods of about 20 and 60 years, respectively, are synchronized to the orbital periods of Jupiter and Saturn. Schwabe and Hale solar cycles are also visible in the temperature records. A 9.1-year cycle is synchronized to the Moon’s orbital cycles. A phenomenological model based on these astronomical cycles can be used to well reconstruct the temperature oscillations since 1850 and to make partial forecasts for the 21st century. It is found that at least 60% of the global warming observed since 1970 has been induced by the combined effect of the above natural climate oscillations. The partial forecast indicates that climate may stabilize or cool until 2030–2040. Possible physical mechanisms are qualitatively discussed with an emphasis on the phenomenon of collective synchronization of coupled oscillators.
Conclusion
On secular, millenarian and larger time scales astronomical oscillations and solar changes drive climate variations. Shaviv’s theory (2003) can explain the large 145 Myr climate oscillations during the last 600 million years. Milankovic’s theory(1941) can explain the multi-millennial climate oscillations observed during the last 1000 kyr. Climate oscillations with periods of 2500, 1500, and 1000 years during the last 10,000 years (the Holocene) are correlated to equivalent solar cycles that caused the Minoan, Roman, Medieval and Modern warm periods(Bond etal.,2001; Kerr, 2001). Finally, several other authors found tha multi-secular solar oscillations caused bi-secular little ice ages (for example: the Sporer, Maunder, Dalton minima) during the last 1000 years (for example: Eddy, 1976; Eichler et al.,2009; Scafetta and West, 2007; Scafetta, 2009,2010).
Herein, we have found empirical evidences that the climate oscillations within the secular scale are very likely driven by astronomical cycles, too. Cycles with periods of 10–11, 12, 15, 20–22, 30 and 60 years are present in all major surface temperature records since 1850, and can be easily linked to the orbits of Jupiter and Saturn. The 11 and 22-year cycles are the well-known Schwabe and Hale solar cycles. Other faster cycles with periods between 5 and 10 years are in common between the temperature records and the astronomical cycles. Long-term lunar cycles induce a 9.1-year cycle in the temperature records and probably other cycles, including an 18.6-year cycle in some regions (McKinnell and Crawford, 2007). A quasi-60 year cycle has been found in numerous multi-secular climatic records, and it is even present in the traditional Chinese, Tibetan and Tamil calendars, which are arranged in major 60-year cycles. …
The existence of a 60-year natural cycle in the climate system, which is clearly proven in multiple studies and herein in Figs. 2, 6, 10 and 12, indicates that the AGWT promoted by the IPCC (2007), which claims that 100% of the global warming observed since 1970 is anthropogenic,is erroneous. In fact, since 1970 a global warming of about 0.5ºC has been observed. However, from 1970 to 2000 the 60-year natural cycle was in the warming phase and has contributed no less than 0.3ºC of the observed 0.5ºC warming, as Fig. 10B shows. Thus, at least 60% of the observed warming since 1970 has been naturally induced. This leaves less than 40% of the observed warming to human emissions. Consequently, the current climate models, by failing to simulate the observed quasi-60 year temperature cycle, have significantly over estimated the climate sensitivity to anthropogenic GHG emissions by likely a factor of three. …
The Anthropogenic Greenhouse Era Began Thousands of Years Ago
William F. Ruddiman. 2003. The Anthropogenic Greenhouse Era Began Thousands of Years Ago. Climatic Change 61: 261–293.
Full text [here]
Selected excerpts:
Abstract
The anthropogenic era is generally thought to have begun 150 to 200 years ago, when the industrial revolution began producing CO2 and CH4 at rates sufficient to alter their compositions in the atmosphere. A different hypothesis is posed here: anthropogenic emissions of these gases first altered atmospheric concentrations thousands of years ago. This hypothesis is based on three arguments. (1) Cyclic variations in CO2 and CH4 driven by Earth-orbital changes during the last 350,000 years predict decreases throughout the Holocene, but the CO2 trend began an anomalous increase 8000 years ago, and the CH4 trend did so 5000 years ago. (2) Published explanations for these mid- to late-Holocene gas increases based on natural forcing can be rejected based on paleoclimatic evidence. (3) A wide array of archeological, cultural, historical and geologic evidence points to viable explanations tied to anthropogenic changes resulting from early agriculture in Eurasia, including the start of forest clearance by 8000 years ago and of rice irrigation by 5000 years ago. In recent millennia, the estimated warming caused by these early gas emissions reached a global-mean value of ~0.8ºC and roughly 2ºC at high latitudes, large enough to have stopped a glaciation of northeastern Canada predicted by two kinds of climatic models. CO2 oscillations of ~10 ppm in the last 1000 years are too large to be explained by external (solar-volcanic) forcing, but they can be explained by outbreaks of bubonic plague that caused historically documented farm abandonment in western Eurasia. Forest regrowth on abandoned farms sequestered enough carbon to account for the observed CO2 decreases. Plague-driven CO2 changes were also a significant causal factor in temperature changes during the Little Ice Age (1300–1900 AD).
Introduction
Crutzen and Stoermer (2000) called the time during which industrial-era human activities have altered greenhouse gas concentrations in the atmosphere (and thereby affected Earth’s climate) the “Anthropocene”. They placed its start at 1800 A.D., the time of the first slow increases of atmospheric CO2 and CH4 concentrations above previous longer-term values. Implicit in this view is a negligible human influence on gas concentrations and Earth’s climate before 1800 AD.
The hypothesis advanced here is that the Anthropocene actually began thousands of years ago as a result of the discovery of agriculture and subsequent technological innovations in the practice of farming. This alternate view draws on two lines of evidence. First, the orbitally controlled variations in CO2 and CH4 concentrations that had previously prevailed for several hundred thousand years fail to explain the anomalous gas trends that developed in the middle and late Holocene.
Second, evidence from palynology, archeology, geology, history, and cultural anthropology shows that human alterations of Eurasian landscapes began at a small scale during the late stone age 8000 to 6000 years ago and then grew much larger during the subsequent bronze and iron ages. The initiation and intensification of these human impacts coincide with, and provide a plausible explanation for, the
divergence of the ice-core CO2 and and CH4 concentrations from the natural trends
predicted by Earth-orbital changes.
Genetic variation in the southern pines: evolution, migration, and adaptation following the Pleistocene
Ronald Schmidtling. 2007. Genetic variation in the southern pines: evolution, migration, and adaptation following the Pleistocene. IN Kabrick, John M.; Dey, Daniel C.; Gwaze, David, eds. Shortleaf pine restoration and ecology in the Ozarks: proceedings of a symposium; 2006 November 7-9; Springfield, MO. Gen. Tech. Rep. NRS-P-15. Newtown Square, PA: U.S. Department of Agriculture, Forest Service, Northern Research Station: 28-32.
Full text [here]
Selected excerpts:
ABSTRACT
Climate has certainly changed over time, requiring genetic change or migration of forest tree species. Little is known about the location of the southern pines during the Pleistocene glaciation, which ended around 14,000 years ago. Macrofossils of spruce (Picea spp.) dating from the late Pleistocene, which are typical of climates much cooler than presently occupied by the southern pines, have been found within the current range of the southern pines, indicating that the climate was considerably colder at that time. From this discovery it is reasonable to assume that the southern pines were situated south of their present range during the Pleistocene and migrated to their current location after the glaciers receded. Variation in adaptive and non-adaptive traits of the southern pines suggests that loblolly pine (Pinus taeda) existed in two refugia, one in south Texas/north Mexico, and one in south Florida. Longleaf pine (P. palustris) probably existed only in the western refugium. Slash pine (P. elliottii), on the other hand, presumably resided only in the Florida refugium, whereas shortleaf pine (P. echinata) is cold-hardy enough to have existed in a continuous distribution across the Gulf Coast. Implications of climate warming on the future of southern pines are discussed.
CONCLUSIONS
In spite of the relative uniformity of the Coastal Plain of the southeastern United States, important genetic differences exist among the southern pine species in response to the last glaciation. Longleaf pine resided in a southwestern refugium and slash pine in a Florida refugium. Loblolly pine resided in both refugia, the two populations being isolated genetically. Shortleaf pine probably resided in a continuous population across the exposed continental shelf. The many advances and retreats of glaciation during the Pleistocene undoubtedly had profound effects on variation and speciation in the southern pines.
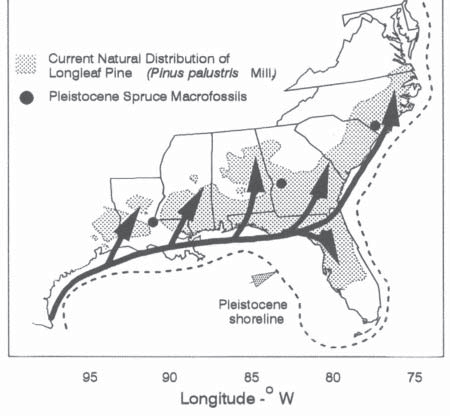
Figure 2.—Post-Pleistocene migration route accounting for the variation. Adapted from Schmidtling and Hipkins (1998).
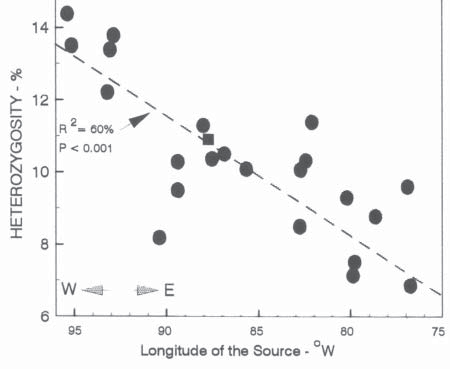
Figure 3.—Variation in expected heterozygosity by longitude in longleaf pine. Adapted from Schmidtling and Hipkins (1998).

Figure 4.—Current natural distribution of loblolly pine showing the frequency of trees with high cortical limonene content. Also shown are the proposed Pleistocene refugia and migration routes.

Figure 5.—Proposed location of the major southern pines during the Wisconsin Glaciation.
Variations in the Earth’s Orbit: Pacemaker of the Ice Ages
J. D. Hays, John Imbrie, N. J. Shackleton. 1976. Variations in the Earth’s Orbit: Pacemaker of the Ice Ages. Science, New Series, Vol. 194, No. 4270, (Dec. 10, 1976), pp. 1121-1132.
Note: this classic, seminal paper changed the science of paleoclimatology. It is one of the most important papers ever written in any scientific discipline.
Full text [here]
Selected excerpts:
Introduction
For more than a century the cause of fluctuations in the Pleistocene ice sheets has remained an intriguing and unsolved scientific mystery. Interest in this problem has generated a number of possible explanations (1, 2). One group of theories invokes factors external to the climate system, including variations in the output of the sun, or the amount of solar energy reaching the earth caused by changing concentrations of interstellar dust (3); the seasonal and latitudinal distribution of incoming radiation caused by changes in the earth’s orbital geometry (4); the volcanic dust content of the atmosphere (5); and the earth’s magnetic field (6). Other theories are based on internal elements of the system believed to have response times sufficiently long to yield fluctuations in the range 104 to 106 years. Such features include the growth and decay of ice sheets (7), the surging of the Antarctic ice sheet (8); the ice cover of the Arctic Ocean (9); the distribution of carbon dioxide between atmosphere and ocean (10); and the deep circulation of the ocean (11). Additionally, it has been argued that as an almost intransitive system, climate could alternate between different states on an appropriate time scale without the intervention of any external stimulus or internal time constant (12).
Among these ideas, only the orbital hypothesis has been formulated so as to predict the frequencies of major Pleistocene glacial fluctuations. Thus it is the only explanation that can be tested geologically by determining what these frequencies are. Our main purpose here is to make such a test. Previous work has provided strong suggestive evidence that orbital changes induced climatic change (13-20). However, two primary obstacles have led to continuing controversy. The first is the uncertainty in identifying which aspects of the radiation budget are critical to climatic change. Depending on the latitude and season considered most significant, grossly different climatic records can be predicted from the same astronomical data. Milankovitch (4) followed Koppen and Wegener’s (21) view that the distribution of summer insolation (solar radiation received at the top of the atmosphere) at 65N should be critical to the growth and decay of ice sheets. Hence the curve of summer insolation at this latitude has been taken by many as a prediction of the world climate curve. Kukla (19) has pointed out weaknesses in Koppen and Wegener’s proposal and has suggested that the critical time may be September and October in both hemispheres. However, several other curves have been supported by plausible arguments. As a result, dates estimated for the last interglacial on the basis of these curves have ranged from 80,000 to 180,000 years ago (22).
The Government Grant System: Inhibitor of Truth and Innovation?
Donald W. Miller, Jr. 2007. The Government Grant System: Inhibitor of Truth and Innovation? Journal of Information Ethics, 2007, pp 59-69.
Donald W. Miller, Jr., is a professor of surgery at the University of Washington School of Medicine. He received his M.D. degree from Harvard and did his cardiothoracic surgery residency at Columbia-Presbyterian Medical Center. He has written two books on heart surgery and one, Heart in Hand, on the philosophy of Arthur Schopenhauer, films of Woody Allen, and his life as a heart surgeon. He also writes articles for LewRockwell.com, which includes pieces on the importance of integrative medicine for maintaining optimum health.
Full text [here]
Selected Excerpts:
Introduction
Flush with success in creating an atom bomb, the U.S. federal government decided it should start funding nonmilitary scientific research. A government report entitled “Science, the Endless Frontier” provides the justification for doing this. It makes the case that “science is the responsibility of government because new scientific knowledge vitally affects our health, our jobs, and our national security” (Bush, 1945). Accordingly, the government established a Research Grants Office in January 1946 to award grants for research in the biomedical and physical sciences. It received 800 grant applications that year. The Research Grants Office is now known as the Center for Scientific Review (CSR), and it processes applications submitted to the National Institutes of Health (NIH) and other agencies in the U.S. Department of Health and Human Services (HHS). In 2005, CSR received 80,000 grant applications. …
Twenty-six federal granting agencies now manage 1,000 grant programs. Even clinical trials of drugs, vaccines, and devices, where industry may profit from the outcome, have come under the purview of government. Zarin and colleagues (2005) reviewed ClinicalTrials.gov records and found that the federal government currently funds 9,796 (51%) of the 19,355 interventional trials being conducted. Industry sponsors 4,734 (24%); and universities, foundations, and other organizations, 4,825 (25%). Under the current system scientists are expected to spend time drafting, writing, and refining unsolicited R01 grant applications, despite a less than one in ten chance of success.
Ethics of Writing Grant Proposals
Ethics in science and society “describe appropriate behavior according to contemporary standards” (Friedman, 1996). Two standards that scientists follow for writing grant proposals are 1) Keep it safe and survive, and 2) Don’t lie if you don’t have to. Pollack (2005) addresses the first ethic, noting that the paramount motivational factor for scientists today is the competition to survive. A scientist’s most pressing need, which supersedes the scientific pursuit of truth, is to get her grant funded—to pay her salary and that of her staff, to pay department bills, and to obtain academic promotion. The safest way to generate grants is to avoid any dissent from orthodoxy. Grant-review study sections whose members’ expertise and status are tied to the prevailing view do not welcome any challenge to it. A scientist who writes a grant proposal that dissents from the ruling paradigm will be left without a grant. Speaking for his fellow scientists Pollack writes, “We have evolved into a culture of obedient sycophants, bowing politely to the high priests of orthodoxy.” …
With regard to the second ethic, Albert Szent-Györgyi said, “I always tried to live up to Leo Szilard’s commandment, ‘Don’t lie if you don’t have to.’ I had to. I filled up pages with words and plans I know I would not follow. When I go home from my laboratory in the late afternoon, I often do not know what I am going to do the next day. I expect to think that up during the night. How could I tell them what I would do a year hence?” (qtd. in Moss, 1988, p. 217). This long-time cancer researcher, discoverer of vitamin C, and Nobel laureate was unable, despite multiple attempts, to obtain a government grant. Friedman (1996) describes a variant of this ethic where an investigator applies for a grant to do a study that he has already completed. With this grant awarded and money in hand he publishes the study and uses the funds on a different project. The misrepresentation enables the investigator to remain one project ahead of his funding. Apparently enough seasoned investigators do this that the academic community views the practice as sound “grantsmanship.”
Pre-industrial CO2 levels were about the same as today
- How and why we are told otherwise
By Dr. Tim Ball, from the Canada Free Press, December 10, 2008 [here]
How many failed predictions, discredited assumptions and evidence of incorrect data are required before an idea loses credibility? CO2 is not causing warming or climate change. It is not a toxic substance or a pollutant. Despite this President Elect Obama met with Al Gore on December 9 no doubt to plan a climate change strategy based on these problems. They make any plan to reduce CO2 completely unnecessary.
Proponents of human induced warming and climate change told us that an increase in CO2 precedes and causes temperature increases. They were wrong. They told us the late 20th century was the warmest on record. They were wrong. They told us, using the infamous “hockey stick” graph, the Medieval Warm Period (MWP) did not exist. They were wrong. They told us global temperatures would increase through 2008 as CO2 increased. They were wrong. They told us Arctic ice would continue to decrease in area through 2008. They were wrong. They told us October 2008 was the second warmest on record. They were wrong. They told us 1998 was the warmest year on record in the US. They were wrong it was 1934. They told us current atmospheric levels of CO2 are the highest on record. They are wrong. They told us pre-industrial atmospheric levels of CO2 were approximately 100 parts per million (ppm) lower than the present 385 ppm. They are wrong. This last is critical because the claim is basic to the argument that humans are causing warming and climate change by increasing the levels of atmospheric CO2 and have throughout the Industrial era. In fact, pre-industrial CO2 levels were about the same as today, but how did they conclude they were lower?
In a paper submitted to the Hearing before the US Senate Committee on Commerce, Science, and Transportation, Professor Zbigniew Jaworowski explains,
The basis of most of the IPCC conclusions on anthropogenic causes and on projections of climatic change is the assumption of low level of CO2 in the pre-industrial atmosphere. This assumption, based on glaciological studies, is false.
Ice cores provide the historic record and data collected at Mauna Loa the recent record. Both records are drastically modified to produce a smooth continuous curve with little variability. This was necessary to confirm the evidence falsely concluded from many 19th century measures that pre-industrial levels were approximately 280 ppm and didn’t vary much. So how did they engineer the smooth curves and ignore the fact the 19th century record shows a global average of 335 ppm and considerable variability from year to year.
Global Cooling Is Here! Evidence for Predicting Global Cooling For the Next Three Decades
Don J. Easterbrook*. 2008. Global Cooling Is Here! Evidence for Predicting Global Cooling For the Next Three Decades
*Dept. of Geology, Western Washington University, Bellingham, WA
Full text [here] (660 KB)
Selected Excerpts:
Introduction
Despite no global warming in 10 years and recording setting cold in 2007-2008, the Intergovernmental Panel on Climatic Change (IPCC) and computer modelers who believe that CO2 is the cause of global warming still predict the Earth is in store for catastrophic warming in this century. IPCC computer models have predicted global warming of 1° F per decade and 5-6° C (10-11° F) by 2100 (Fig. 1), which would cause global catastrophe with ramifications for human life, natural habitat, energy and water resources, and food production. All of this is predicated on the assumption that global warming is caused by increasing atmospheric CO2 and that CO2 will continue to rise rapidly.
However, records of past climate changes suggest an altogether different scenario for the 21st century. Rather than drastic global warming at a rate of 0.5 ° C (1° F) per decade, historic records of past natural cycles suggest global cooling for the first several decades of the 21st century to about 2030, followed by global warming from about 2030 to about 2060, and renewed global cooling from 2060 to 2090 (Easterbrook, D.J., 2005, 2006a, b, 2007, 2008a, b); Easterbrook and Kovanen, 2000, 2001). Climatic fluctuations over the past several hundred years suggest ~30 year climatic cycles of global warming and cooling, on a general rising trend from the Little Ice Age.
Predictions Based on Past Climate Patterns
Global climate changes have been far more intense (12 to 20 times as intense in some cases) than the global warming of the past century, and they took place in as little as 20–100 years. Global warming of the past century (0.8° C) is virtually insignificant when compared to the magnitude of at least 10 global climate changes in the past 15,000 years. None of these sudden global climate changes could possibly have been caused by human CO2 input to the atmosphere because they all took place long before anthropogenic CO2 emissions began. The cause of the ten earlier ‘natural’ climate changes was most likely the same as the cause of global warming from 1977 to 1998.
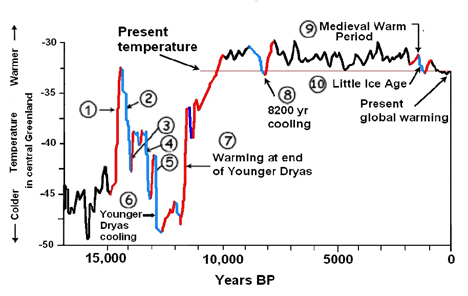
Figure 2. Climate changes in the past 17,000 years from the GISP2 Greenland ice core. Red = warming, blue = cooling. (Modified from Cuffy and Clow, 1997)
Climatic fluctuations over the past several hundred years suggest ~30 year climatic cycles of global warming and cooling (Figure 3) on a generally rising trend from the Little Ice Age about 500 years ago.
After several decades of studying alpine glacier fluctuations in the North Cascade Range, my research showed a distinct pattern of glacial advances and retreats (the Glacial Decadal Oscillation, GDO) that correlated well with climate records. In 1992, Mantua published the Pacific Decadal Oscillation curve showing warming and cooling of the Pacific Ocean that correlated remarkably well with glacial fluctuations. …
The significance of the correlation between the GDO, PDO, and global temperature is that once this connection has been made, climatic changes during the past century can be understood, and the pattern of glacial and climatic fluctuations over the past millennia can be reconstructed. These patterns can then be used to project climatic changes in the future. Using the pattern established for the past several hundred years, in 1998 I projected the temperature curve for the past century into the next century and came up with curve ‘A’ in Figure 5 as an approximation of what might be in store for the world if the pattern of past climate changes continued.
Ironically, that prediction was made in the warmest year of the past three decades and at the acme of the 1977-1998 warm period. At that time, the projected curved indicated global cooling beginning about 2005 ± 3-5 years until about 2030, then renewed warming from about 2030 to about 2060 (unrelated to CO2—just continuation of the natural cycle), then another cool period from about 2060 to about 2090. This was admittedly an approximation, but it was radically different from the 1° F per decade warming called for by the IPCC. Because the prediction was so different from the IPCC prediction, time would obviously show which projection was ultimately correct.
Now a decade later, the global climate has not warmed 1° F as forecast by the IPCC but has cooled slightly until 2007-08 when global temperatures turned sharply downward. In 2008, NASA satellite imagery confirmed that the Pacific Ocean had switched from the warm mode it had been in since 1977 to its cool mode, similar to that of the 1945-1977 global cooling period. The shift strongly suggests that the next several decades will be cooler, not warmer as predicted by the IPCC.
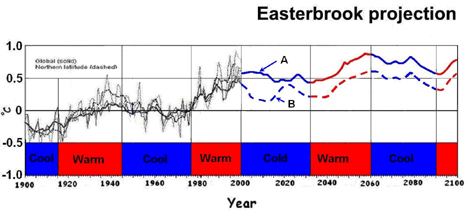
Figure 5. Global temperature projection for the coming century, based on warming/cooling cycles of the past several centuries. ‘A’ projection based on assuming next cool phase will be similar to the 1945-1977 cool phase. ‘B’ projection based on assuming next cool phase will be similar to the 1880-1915 cool phase. The predicted warm cycle from 2030 to 2060 is based on projection of the 1977 to 1998 warm phase and the cooling phase from 2060 to 2090 is based on projection of the 1945 to 1977 cool cycle.
Implications of PDO, NAO, GDO, and sun spot cycles for global climate in coming decades
The IPCC prediction of global temperatures, 1° F warmer by 2011 and 2° F by 2038 (Fig. 1), stand little chance of being correct. NASA’s imagery showing that the Pacific Decadal Oscillation (PDO) has shifted to its cool phase is right on schedule as predicted by past climate and PDO changes (Easterbrook, 2001, 2006, 2007). The PDO typically lasts 25-30 years and assures North America of cool, wetter climates during its cool phases and warmer, drier climates during its warm phases. The establishment of the cool PDO, together with similar cooling of the North Atlantic Oscillation (NAO), virtually assures several decades of global cooling and the end of the past 30-year warm phase. It also means that the IPCC predictions of catastrophic global warming this century were highly inaccurate.
The switch of PDO cool mode to warm mode in 1977 initiated several decades of global warming. The PDO has now switched from its warm mode (where it had been since 1977) into its cool mode….
The Pacific Ocean has a warm temperature mode and a cool temperature mode, and in the past century, has switched back forth between these two modes every 25-30 years (known as the Pacific Decadal Oscillation or PDO). In 1977 the Pacific abruptly shifted from its cool mode (where it had been since about 1945) into its warm mode, and this initiated global warming from 1977 to 1998. The correlation between the PDO and global climate is well established. The announcement by NASA’s Jet Propulsion Laboratory that the Pacific Decadal Oscillation (PDO) had shifted to its cool phase is right on schedule as predicted by past climate and PDO changes (Easterbrook, 2001, 2006, 2007). The PDO typically lasts 25-30 years and assures North America of cool, wetter climates during its cool phases and warmer, drier climates during its warm phases. The establishment of the cool PDO, together with similar cooling of the North Atlantic Oscillation (NAO), virtually assures several decades of global cooling and the end of the past 30-year warm phase. …
The ramifications of the global cooling cycle for the next 30 years are far reaching — e.g., failure of crops in critical agricultural areas (it’s already happening this year), increasing energy demands, transportation difficulties, and habitat change. All this during which global population will increase from six billion to about nine billion. The real danger in spending trillions of dollars trying to reduce atmospheric CO2 is that little will be left to deal with the very real problems engendered by global cooling.
Conclusions
Global warming (i.e, the warming since 1977) is over. The minute increase of anthropogenic CO2 in the atmosphere (0.008%) was not the cause of the warming—it was a continuation of natural cycles that occurred over the past 500 years.
The PDO cool mode has replaced the warm mode in the Pacific Ocean, virtually assuring us of about 30 years of global cooling, perhaps much deeper than the global cooling from about 1945 to 1977. Just how much cooler the global climate will be during this cool cycle is uncertain. Recent solar changes suggest that it could be fairly severe, perhaps more like the 1880 to 1915 cool cycle than the more moderate 1945-1977 cool cycle. A more drastic cooling, similar to that during the Dalton and Maunder minimums, could plunge the Earth into another Little Ice Age, but only time will tell if that is likely.
An Urgent Signal for the Coming Ice Age
Harris, Peter John Faraday. 2008. An Urgent Signal for the Coming Ice Age
Full text [here]
Selected excerpts:
When paleoclimatologists met in 1972 to discuss how and when the present warm climate would end , termination of this warm climate we call the Holocene seemed imminent and it was expected that rapid cooling would lead to the coming ice age. These ideas were based on the 1M year analogue for climate transitions first proposed by Milankovitch over 60 years ago, which has been demonstrated to show the correlation of glacial and interglacial climate with solar insolation as it is modulated by our changing distance from the sun. These data sets may be used to serve as a signal for the coming ice age. Orbital geometry was approaching similar conditions to those of the previous transitions to ice.
But soon it was observed that global temperature was increasing and at about this time Global Climate Modeling (GCM) received more attention and the Milankovitch analogue was forgotten. There has been no further discussion about the coming ice age. …
Then using a modeled Holocene they projected climate using a range of CO2 forcing, and they reported that there was no transition to ice for at least 30KY into the future.
The algorithm for this process is not disclosed but the authors rightly list the limitations of the model in which CO2 is considered as an external forcing ie the carbon cycle is not simulated by the model. Clouds and the hydrological cycle are simplified and so is the heat transport to middle and deep ocean. In addition, regional changes such as the North Atlantic and over Europe are not simulated “and might depart from the global trend.”
It is unfortunate that these limitations appear to have been ignored and the AGW [anthropogenic global warming] hypothesis was born and has occupied science and the media ever since. The Milankovich analogue has been forgotten.
more »
Reconstructing Climatic and Environmental Changes of the Past 1000 Years: A Reappraisal
Soon, Willie, Sallie Baliunas, Craig Idso, Sherwood Idso, and David R. Legates. 2003. Reconstructing Climatic and Environmental Changes of the Past 1000 Years: A Reappraisal. Energy & Environment, Vol. 14, Nos. 2 & 3, 2003.
Full text [here] (927 KB)
Selected excerpts:
ABSTRACT
The 1000-year climatic and environmental history of the Earth contained in various proxy records is examined. As indicators, the proxies duly represent or record aspects of local climate. Questions on the relevance and validity of the locality paradigm for climatological research become sharper as studies of climatic changes on timescales of 50–100 years or longer are pursued. This is because thermal and dynamical constraints imposed by local geography become increasingly important as the air-sea-land interaction and coupling timescales increase. Because the nature of the various proxy climate indicators are so different, the results cannot be combined into a simple hemispheric or global quantitative composite. However, considered as an ensemble of individual observations, an assemblage of the local representations of climate establishes the reality of both the Little Ice Age and the Medieval Warm Period as climatic anomalies with world-wide imprints, extending earlier results by Bryson et al. (1963), Lamb (1965), and numerous other research efforts. Furthermore, these individual proxies are used to determine whether the 20th century is the warmest century of the 2nd Millennium at a variety of globally dispersed locations. Many records reveal that the 20th century is likely not the warmest nor a uniquely extreme climatic period of the last millennium, although it is clear that human activity has significantly impacted some local environments.
1. INTRODUCTION
Are the Little Ice Age and Medieval Warm Period widespread climatic anomalies? Nearly four decades ago, H. H. Lamb (1965, pp. 14–15) wrote,
“[M]ultifarious evidence of a meteorological nature from historical records, as well as archaeological, botanical and glaciological evidence in various parts of the world from the Arctic to New Zealand… has been found to suggest a warmer epoch lasting several centuries between about A.D. 900 or 1000 and about 1200 or 1300… Both the “Little Optimum” in the early Middle Ages and the cold epochs [i.e., “Little Ice Age”], now known to have reached its culminating stages between 1550 and 1700, can today be substantiated by enough data to repay meteorological investigation… It is high time therefore to marshal the climatic evidence and attempt a quantitative evidence.” …
Thirty-three years later, however, Jones et al. (1998) tentatively concluded that,
“[w]hile the ‘Little Ice Age’ cooling (with the seventeenth century being more severe over Eurasia and the nineteenth century more severe over North America) is clearly evident … we can only concur… that there is little evidence for the ‘Medieval Warm Period’… although the fact that we have only four series before 1400 and the timescale limitations described earlier [i.e., not resolving timescales of multidecades to century with tree ring proxies used in their study] caution against dismissing the feature.” …
These results are but a few of the many that have become available since Lamb’s pioneering analysis. Given advancements in retrieval of information from climate proxies, as well as their extensive surface coverage, we review the accumulated evidence on climatic anomalies over the last 1000 years. ..
more »
Solar Cycle 24: Implications for the United States
Archibald, David. 2008. Solar Cycle 24: Implications for the United States. International Conference on Climate Change March, 2008.
Full text [here]
Selected excerpts:
Do we live in a special time in which the laws of physics and nature are suspended? No, we do not. Can we expect relationships between the Sun’s activity and climate, that we can see in data going back several hundred years, to continue for at least another 20 years? With absolute certainty.
In this presentation, I will demonstrate that the Sun drives climate, and use that demonstrated relationship to predict the Earth’s climate to 2030. It is a prediction that differs from most in the public domain. It is a prediction of imminent cooling.
To put the solar – climate relationship in context, we will begin by looking at the recent temperature record, and then go further back in time. Then we will examine the role of the Sun in changing climate, and following that the contribution of anthropogenic warming from carbon dioxide.
I will show that increased atmospheric carbon dioxide is not even a little bit bad. It is wholly beneficial. The more carbon dioxide we can put into the atmosphere, the better the planet will be – for humans, and all other living things. …
To reconstruct climate prior to thermometer records, isotope ratios and tree ring widths are used. This graph shows the Medieval Warm Period and Little Ice Age. The peak of the Medieval Warm Period was 2° warmer than today and the Little Ice Age 2° colder at its worst. The total range is 4° centigrade. The warming over the 20th century was 0.6 degrees by comparison. This recent warming has melted ice on some high passes in the Swiss Alps, uncovering artifacts from the Medieval Warm Period and the prior Roman Warm Period. …
It was warmer again not long after the last ice age ended. Sea level was 2 metres than it is today. Since the Holocene Optimum about eight thousand years ago, we been in long term temperature decline at about 0.25 degrees per thousand years.
When I asked at the beginning of this presentation if we lived in a special time, well that is true in relation to the last three million years. The special time we live in is called an interglacial. Normally, and that is 90% of the time, the spot I am standing on is covered by several thousand feet of ice. Relative to the last four interglacials, we may be somewhere near the end of the current interglacial. The end of the Holocene will be a brutal time for humanity. …
The Holocene, the period we are in now, is tracking along with three of the four previous interglacials. Of those three, if the Holocene ends up being like the Eemian, then we may have up to 3,000 years of Little Ice Age-like conditions before we plunge into the next glacial period. If not, then the plunge could start any time now. …
more »
Nature, Not Human Activity, Rules the Climate
Singer, S. Fred, ed., Nature, Not Human Activity, Rules the Climate: Summary for Policymakers of the Report of the Nongovernmental International Panel on Climate Change, Chicago, IL: The Heartland Institute, 2008.
Full text [here] (4,343 KB)
Selected excerpts:
In his speech at the United Nations’ climate conference on September 24, 2007, Dr. Vaclav Klaus, president of the Czech Republic, said it would most help the debate on climate change if the current monopoly and one-sidedness of the scientific debate over climate change by the Intergovernmental Panel on Climate Change (IPCC) were eliminated. He reiterated his proposal that the UN organize a parallel panel and publish two competing reports.
The present report of the Nongovernmental International Panel on Climate Change (NIPCC) does exactly that. It is an independent examination of the evidence available in the published, peer-reviewed literature – examined without bias and selectivity. It includes many research papers ignored by the IPCC, plus additional scientific results that became available after the IPCC deadline of May 2006. …
The NIPCC project was conceived and directed by Dr. S. Fred Singer, professor emeritus of environmental sciences at the University of Virginia. He should be credited with assembling a superb group of scientists who helped put this volume together.
Singer is one of the most distinguished scientists in the U.S. In the 1960s, he established and served as the first director of the U.S. Weather Satellite Service, now part of the National Oceanographic and Atmospheric Administration (NOAA), and earned a U.S. Department of Commerce Gold Medal Award for his technical leadership. In the 1980s, Singer served for five years as vice chairman of the National Advisory Committee for Oceans and Atmosphere (NACOA)…
Our concern about the environment, going back some 40 years, has taught us important lessons. It is one thing to impose drastic measures and harsh economic penalties when an environmental problem is clear-cut and severe. It is foolish to do so when the problem is largely hypothetical and not substantiated by observations. As NIPCC shows by offering an independent, non-governmental ‘second opinion’ on the ‘global warming’ issue, we do not currently have any convincing evidence or observations of significant climate change from other than natural causes. …
more »
The Role of Solar Activity on Holocene Glacier Length Variability in the Swiss Alps
Hormes, A., Beer, J. and Schlüchter, C., 2006. A geochronological approach to understanding the role of solar activity on Holocene glacier length variability in the Swiss Alps. Geogr. Ann., 88 A (4): 281–294.
Review by George Taylor
A team of European researchers has found that glaciers in the Swiss Alps have lengthened and receded repeatedly during the Holocene in significant correlation with changes in solar irradiance.
Anne Hormes of Ångströmlaboratory, Uppsala University, Sweden, Jürg Beer of the Department of Surface Waters, EAWAG, Dübendorf, Switzerland, and Christian Schlüchter of the Department of Quaternary and Environmental Geology, University of Bern, Bern, Switzerland were the researchers.
Abstract — We present a radiocarbon data set of 71 samples of wood and peat material that melted out or sheared out from underneath eight present day mid-latitude glaciers in the Central Swiss Alps. Results indicated that in the past several glaciers have been repeatedly less extensive than they were in the 1990s. The periods when glaciers had a smaller volume and shorter length persisted between 320 and 2500 years. This data set provides greater insight into glacier variability than previously possible, especially for the early and middle Holocene. The radiocarbon-dated periods defined with less extensive glaciers coincide with periods of reduced radioproduction, pointing to a connection between solar activity and glacier melting processes. Measured long-term series of glacier length variations show significant correlation with the total solar irradiance. Incoming solar irradiance and changing albedo can account for a direct forcing of the glacier mass balances. Long-term investigations of atmospheric processes that are in interaction with changing solar activity are needed in order to understand the feedback mechanisms with glacier mass balances.
The researchers radiocarbon dated bits of wood and peat material that emerged from underneath eight present day mid-latitude glaciers in the Central Swiss Alps. The organic matter had grown in the glacial basins when the glaciers were smaller:
more »