Lolo Elk Decline
The Idaho Department of Fish and Game has released the aerial elk counts for the Lolo Wildlife Management Zones 10 and 12 in the Clearwater River watershed in Idaho. The counts along with counts of prior years are graphed below:
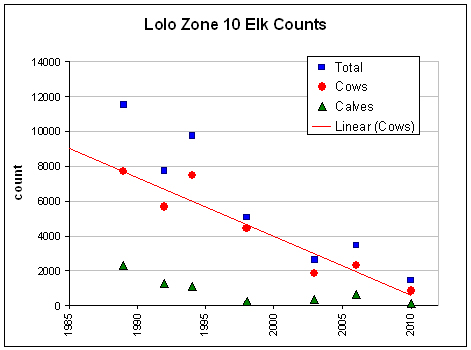
Lolo Zone 10 aerial elk counts 1989-2010.
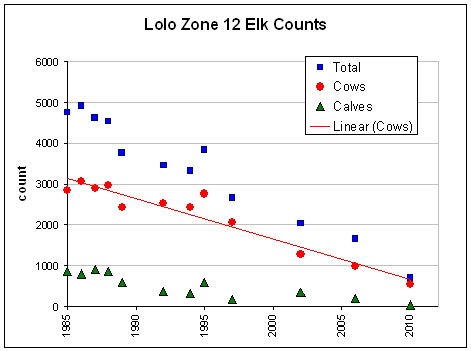
Lolo Zone 12 aerial elk counts 1989-2010.
Discussion
All aerial elk counts were made in January or February, although not in every year. The data I received did not include any estimates of the uncertainty (statistical error) associated with the counting method.
Total count and counts of cows and calves by year are displayed. The count of cows is particularly important. This is because in ungulates the number of cows, that is the number of females capable of bearing young, are critical to population dynamics. One bull can impregnate many cows, so the number of bulls can vary greatly and not affect the birth rate or population change trends. That is not true for cows, which can bear only one or two calves (twins are rare) per year. On average most cows will have their first calf at 3 years of age. The gestation for elk cows is 250 days, which means calves are generally born in May and June. Calves counted in winter are those which have survived for six to nine months.
Also included in the graphs are linear trend lines for the cow count. In Zone 10 the number of cows has declined from 7,692 in 1989 to 824 in 2010, or 89 percent. In Zone 12 the number of cows has declined from 3,059 in 1986 to 534 in 2010, or 83 percent.
In Zone 10 the number of calves has declined from 2,298 in 1989 to 144 in 2010, or 94 percent. In Zone 12 the number of calves has declined from 856 in 1985 to 38 in 2010, or 96 percent.
Clearly, the elk populations have crashed in these zones.
The reason is not a lack of fecundity: calf/cow ratios have varied from 6 per 100 to 30 per 100 and were reported to be 17 per 100 in Zone 10 and 7 per 100 in Zone 12 in 2010. A calf/cow ratio of 15-20 per 100 is considered to be sufficient to replace the population under normal circumstances, and no trend in calf/cow ratio was detected over the counting period. As recently as 2006 the calf/cow ratios were 29 per 100 in Zone 10 and 20 per 100 in Zone 12.
The reason for the elk population crash is not hunting. All the animals taken are bulls, and that does not affect population dynamics as explained above. Furthermore, Lolo zone elk harvest has also decline precipitously, from over 1,500 in 1989 to less than 150 in 2008 in Zone 10 and from nearly 600 in 1992 to less than 100 in 2008 in Zone 12. I do not have the exact harvest numbers at this time.
The principal reason for the crashing elk populations is undoubtedly the introduction of wolves in 1995, and the subsequent explosion of the wolf population.
Wildlife and People has reported on the wolf problem in the Lolo Wildlife Management zones many times [here, here, here, here, here]. These are just the posts that mention wolves in the Lolo zones. The posts regarding wolves and elk in the Northern Rockies are too numerous to list.
Upcoming IDFG Meetings
The IDFG is holding public meetings next week from 5 to 7 p.m. at the IDFG Clearwater Regional Office in Lewiston on Tuesday and at the Clearwater Hatchery in Orofino on Wednesday. I invite you to print out the graphs above and present them, and ask the IDFG experts why they think the Lolo elk populations have crashed.
by Leon P.
You might also ask IDFG representatives why they reported no trends in Lolo zone elk populations as recently as 2008, when the trends were obvious and severe at that time.
The graphed data are their counts. Can’t they make a graph? Can’t they detect a trend? Are they math-challenged? Why do they make counts if they are not going to analyze them? Why don’t they hire somebody who CAN do math, make graphs, and detect trends?
All good questions to ask. If you make it to the meetings, and ask those questions, please let me know their answers.
Although it has long been “common knowledge” that the ratio of bulls to cows does not affect population dynamics, “common knowledge” is not necessarily valid knowledge. In fact, studies of European elk (”red deer”) and a number of other northern-hemisphere ungulates has shown that the vigor of populations is much higher, and vulnerability to predation is much lower, where bull/cow ratios are high. Read my article “Trophy Bull Management: An Alternate Strategy” in the the fall 1993 issue of Bugle. It will soon be available on the website of the Bear Viewing Association
bear-viewing-in-alaska.info.
The same thing was shown with chamois, which are genetically kin to North American mountain goats, but ecologically more similar to mountain sheep. Indeed, this has also been confirmed for Dall sheep by Wayne Heimer and Sarah Watson. My paper on chamois will also soon be available at the BVA website.
Fish and Game Director Wants Expanded Wolf Hunting
KIVI-TV Channel 6 News, March 9, 2010 [here]
LEWISTON, Idaho (AP) — The director of Idaho Fish and Game says more wolves need to be killed in the Lolo area of the Clearwater River basin to stop the decline in elk populations.
Cal Groen says state wildlife managers will recommend significant changes to wolf seasons in the Lolo and other zones where elk numbers are not at management levels.
He says management tools could include increased harvest limits, multiple tags, trapping, and asking outfitters to help reduce wolf numbers.
Groen says eight of the state’s 29 elk hunting zones are below the department’s population objectives.
He says five of those have significant wolf populations, including the Lolo, Selway and Sawtooth zones.
The hunting changes could be put in place next fall.
by Harry J.
Please ask this question. Why does the IFGD ask that we give survey results of our 2009 hunt and then not post those numbers so they are available prior to us applying for a 2010 tag? If they want us to respond and be prompt, why can’t they?
by Ryan
Another question to ask would be, if the wolves are causing the decline, why were the numbers declining at roughly the same rate even before wolves were reintroduced to the area?
Reply: The straight line decline on the graph is an artifact of the statistical method used (a linear trend was fitted and plotted). The actual population changes were not so linear. And the actual numbers are not known exactly — the dots on the graph represent estimates.
So it would be a inferential leap to assume the pre-wolf and post-wolf declines were at similar rates. However, your point that multiple factors may be responsible is a worthy one. The data do not prove cause-and-effect. Just a very strong correlation. Other evidence, such as known sites in the Lolo Zone where wolves have spree-killed elk, tend to reinforce the wolf-elk decline causal relationship. Known wolf population increase is also circumstantial evidence, but known grizzly bear population increase may be another factor to consider. Human hunting take has declined precipitously, so it is unlikely that hunting has been much of a factor, but it has not been nothing, either. — Mike
Go for it, please, and thank you.