Pacific Northwest Temperatures Have Been Trending Downward For the Last 25 Years, Despite Predictions of Continued Warming
by Ken Schlichte
Reports from Oregon and Washington in recent years have suggested that climate change is resulting in continued temperature increases and pronounced environmental impacts across the Pacific Northwest. These reports also suggest that increases in atmospheric CO2 produced by burning fossil fuels are primarily responsible for these Pacific Northwest temperature increases. The discussion below presents figures and information from the National Climatic Data Center indicating that Pacific Northwest annual temperatures have actually been trending downward at a rate of 0.15°F per decade for the last 25 years and trending downward at a rate of 2.75°F per decade for the last 8 years, even as anthropogenic greenhouse gas emissions and the concentration of atmospheric CO2 were both increasing.
The “Oregon Climate Assessment Report (OCAR) Legislative Summary” [here] released in December 2010 by the Oregon Climate Research Institute, begins with the following statements:
Earth’s climate has changed in the past, though the recent magnitude and pace of changes are unprecedented in human existence. Recent decades have been warmer than at any time in roughly 120,000 years. Most of this warming can be attributed to human activity, primarily burning fossil fuels (coal, oil and natural gas) for energy. Burning fossil fuels releases carbon dioxide and other heat trapping gases, also known as greenhouse gases, into the atmosphere. This warming cannot be ascribed to natural causes (volcanic and solar) alone. It can be said that human activities are primarily responsible for the observed 1.5°F increase in 20th century temperatures in the Pacific Northwest. A warmer climate will affect this state substantially.
Future regional climate changes in Oregon include:
Increases in temperature around 0.2-1°F per decade
Average annual air temperatures will increase through the 21st century. The amount of warming depends partly on the rate of greenhouse gas emissions.
Similar and earlier predictions of Pacific Northwest climate change include “The economic impacts of climate change in Oregon: a preliminary assessment” (Oct. 2005) [here] by the UO Institute for a Sustainable Environment and “Impacts of Climate Change on Washington’s Economy” (Nov. 2006) [here] also by the UO ISE. The first report predicted a regional warming of approximately 1°F per decade over the next several decades, while the second stated that:
Scientists expect the Pacific Northwest climate to warm approximately 0.5ºF every ten years over the next several decades, a rate more than three times faster than the warming experienced during the twentieth century. In Washington, scientists project that average annual temperatures will be 1.9ºF higher by the 2020s when compared with the 1970-1999 average, and 2.9ºF higher by the 2040s.
The Oregon Climate Assessment Report suggested that the “observed” temperatures in the Pacific Northwest increased 1.5°F during the 20th century, but the National Climatic Data Center figure below indicates that Pacific Northwest annual temperatures trended upward at a rate of 0.06°F per decade during the 20th century for a total temperature increase of only 0.60°F.
Annual Temperature
Northwest Region
1900 - 2000
Annual 1900 - 2000 Average = 46.69 degF
Annual 1900 - 2000 Trend = 0.06 degF / Decade
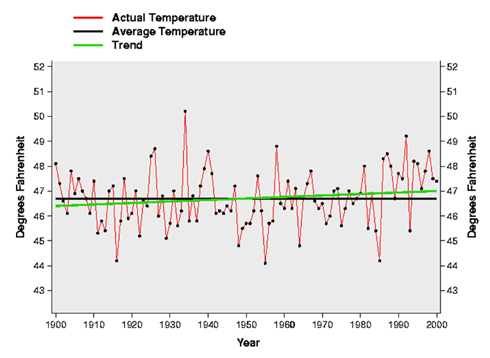
Fig. 1: Pacific Northwest average annual temperatures from 1900 through 2000 with trend line. Data courtesy NCDC.
Despite the statement in “Impacts of Climate Change on Washington’s Economy” that the Pacific Northwest will “continue to warm approximately 0.5°F every ten years over the next several decades”, the NCDC figure below indicates that Pacific Northwest annual temperatures have actually been trending downward at a rate of 0.15°F per decade during the 25 years since 1986.
Annual Temperature
Northwest Region
1986 - 2010
Annual 1986 - 2010 Average = 47.70 degF
Annual 1986 - 2010 Trend = -0.15 degF / Decade
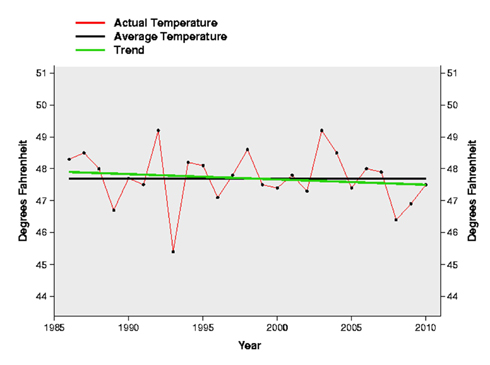
Fig. 2: Pacific Northwest average annual temperatures from 1986 through 2010 with trend line. Data courtesy NCDC.
The NCDC figure below indicates that Pacific Northwest annual temperatures have been trending downward at a rate of 0.76°F per decade during the 13 years since 1998. The NCDC also reports that annual temperatures for the contiguous United States have been trending downward at a rate of 0.94°F per decade during the 13 years since 1998.
Annual Temperature
Northwest Region
1998 - 2010
Annual 1998 - 2010 Average = 47.71 degF
Annual 1998 - 2010 Trend = -0.76 degF / Decade
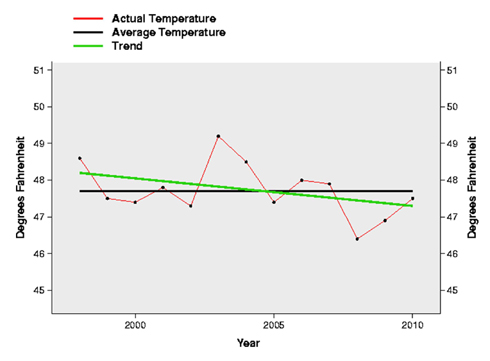
Fig. 3: Pacific Northwest average annual temperatures from 1998 through 2010 with trend line. Data courtesy NCDC.
The NCDC figure below indicates that Pacific Northwest annual temperatures have been trending downward at a rate of 2.75°F per decade during the 8 years since 2003. The NCDC also reports that annual temperatures for the contiguous United States have been trending downward at a rate of 1.21°F per decade during the 8 years since 2003.
Annual Temperature
Northwest Region
2003 - 2010
Annual 2003 - 2010 Average = 47.72 degF
Annual 2003 - 2010 Trend = -2.75 degF / Decade
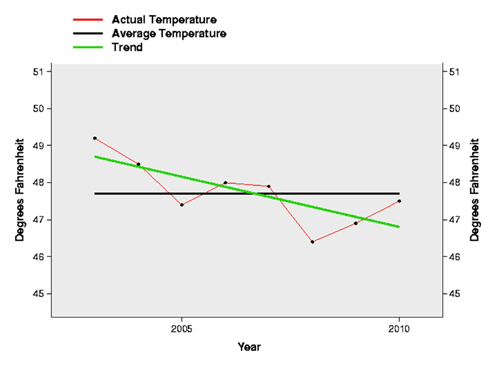
Fig. 4: Pacific Northwest average annual temperatures from 2003 through 2010 with trend line. Data courtesy NCDC.
The National Climatic Data Center figures above indicate that Pacific Northwest annual temperatures trended downward slightly at a rate of 0.15°F per decade during the last 25 years, trended downward more rapidly at a rate of 0.76°F per decade during the last 13 years, and trended downward much more rapidly at a rate of 2.75°F per decade during the last 8 years. It is worth noting that these downward annual temperature trends were occurring even as anthropogenic greenhouse gas emissions and the concentration of atmospheric CO2 were both increasing.
The downward Pacific Northwest annual temperature trends over the last 25 years shown in the National Climatic Data Center figures above contrast with the climate change predictions in the “Oregon Climate Assessment Report”, “Impacts of Climate Change on Washington’s Economy”, and “The Economic Impacts of Climate Change” in Oregon that predict continued Pacific Northwest temperature increases of 0.2-1.0°F per decade over the next few decades. These climate change predictions have significantly influenced climate change legislation and the development of environmental policy and energy policy in Oregon and Washington in recent years.
Development of appropriate climate change legislation, environmental policy and energy policy for Oregon and Washington requires the use of accurate climate data such as that presented in the National Climatic Data Center figures above, not questionable climate change predictions.
Author Ken Schlichte is a retired Washington State Department of Natural Resources forest soil scientist and has taught forest management courses at Shoreline Community College and Centralia Community College
by Richard B.
Today’s ABC evening news ran a segment on climate and blamed flooding and snowfall on global warming. Dr. Richard Somerville, Climate Scientist, Scripps, USCD said it’s all the result of global warming, which he stated has now been proven by science. The National Climatic Data Center figures above, however, indicate that U.S. annual temperatures have actually been trending downward at a rate of 0.94 degrees F per decade since 1998.
It’s seems that the data contradict the “proof” claim. Evidently “science” is not what it used to be. In the old days, when the empirical evidence contradicted the theory, the theory was disproved, not proven. That is not the case with post-modern, post-normal science, which says that the facts and evidence are immaterial.
by TreeC123
Maybe both the floods in Australia and Brazil and the PNW area covered in this post are mere subsets of the global picture. Maybe the answer lies in collecting global data to determine global climate patterns.
You can’t “disprove” a global climate pattern with regional data.
In fact, maybe you can’t prove or disprove anything. You actually find evidence supporting or not supporting a hypothesis. That’s the science process I know and love.
“It’s just Mother Nature’s way of saying ‘BOOGA, BOOGA!’ “…. words of the immortal Robert Klein
I think it is fashion to blame all “bad” weather upon “climate change”. It’s far easier for me to believe in significant solar effects upon the globe than to have some NASA guy claiming that the oceans will boil off, if we don’t do something drastic.

Excellent article; great sources. I will keep this for later reference.