No Trend In Idaho Snowpack Over the Last 75 Years
by Mike Dubrasich, forest biometrician
Maximum winter snowpack in the Snake River watershed has exhibited no trend upward or downward over the last 75 years.
Since 1918 snowpack has been measured at “snotel” locations in the Snake River watershed, which includes most of Idaho and portions of Oregon and Nevada. The snowpack has been measured in snow water equivalents (SWE) at over 700 snotel locations at monthly intervals during winter.
Not all locations have been measured for 90 years; some have been measured for fewer years than that, and some have small to large gaps in the record. Measurements at any particular station have not always been taken in every winter month, although remarkable efforts have been made to measure maximum annual snowpack at most stations.
I selected the 20 longest, continuously measured snotel records from 3 US Army Corps of Engineers databases containing 745 snotel records from the Snake River watershed. Of those selected, the shortest record was 75 years long.
15H04, BIG BEN SNOTEL, 1919-2007
16H01, JACK CREEK, LOWER, 1921-2007
11H03, TONY GROVE RANGER STATION, 1924-2007
11G32, FRANKLIN BASIN SNOTEL, 1924-2007
10E08, ASTER CREEK, 1930-2007
10E09, LEWIS LAKE DIVIDE PILLOW, 1930-2007
10E12, SNAKE RIVER STATION SNOTEL, 1930-2007
10E13, GLADE CREEK, 1930-2007
10E14, HUCKLEBERRY DIVIDE, 1930-2007
10E17, TWO OCEAN PLATEAU SNOTEL, 1930-2007
10F02, BASE CAMP PILLOW, 1930-2007
10F04, MORAN, 1930-2007
10F29, GRANITE CREEK PILLOW, 1930-2007
11H07, GARDEN CITY SUMMIT, 1931-2007
11H36, TONY GROVE LAKE PILLOW, 1931-2007
15H01, BEAR CREEK SNOTEL, 1932-2007
15H05, GOLD CREEK, 1932-2007
15H08, TREMEWAN RANCH, 1932-2007
17H08, GRANITE PEAK SNOTEL, 1932-2007
15F01, MOORES CREEK SUMMIT SNOTEL, 1933-2007
I extracted the maximum (recorded) annual snowpack (MASWE) for each selected snotel station. I graphed those MASWE’s together with the 20 station average and a linear trend (regression) line.
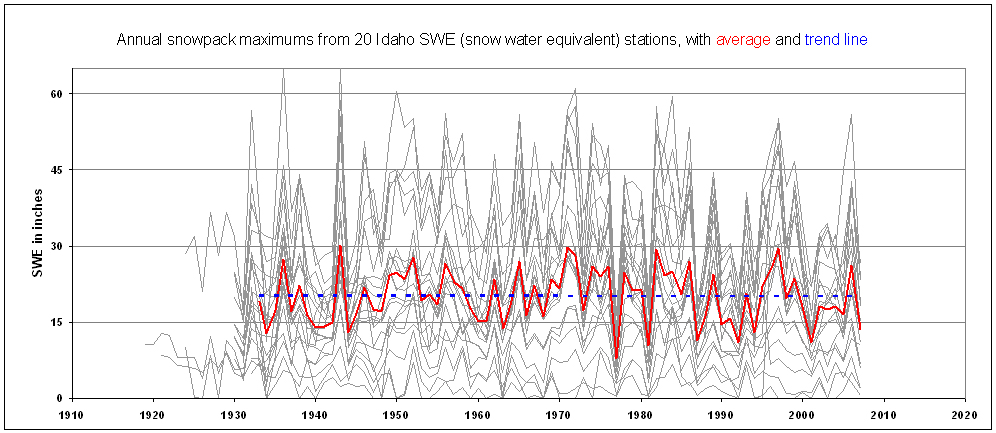
Click on graph for larger image.
The maximum average MASWE for these 20 measurement stations was 30.14 inches and occurred in 1943. The minimum average MASWE was 7.90 inches and occurred in 1977. The 75-year average MASWE for these 20 stations is 20.02 inches.
There has been, however, absolutely no trend in the average MASWE for these stations from 1933 to 2007. The linear regression line through the annual averages has a slope of zero.
Maximum snowpack in the Snake River watershed has neither increased nor decreased over the last 75 years. Although there has been annual variation, there has been no trend toward more or less snow. The trend line is flat, meaning there has been no trend. The Snake River watershed is not getting more snowier or less snowier.
In terms of maximum annual snowpack, there has been no detectable, much less statistically significant, “climate change” in the Snake River watershed over the last 75 years.
Expert climatologist comments are welcome, as are comments by everyone else.
Special thanks and acknowledgements go to George H. Taylor, CCM of Applied Climate Services LLC, Philomath, OR, for supplying the data, and to the hundreds of stalwart snotel technicians who have trudged on snowshoes in the dead of winter to the most remote places in Idaho for the last 90 years. What stories they must have!
by pril
wow. thanks for this, Mike.
by Forrest Grump
Nice work Mike.
Amazing how history rolls on beyond memory.
by YPmule
Thanks for the story Mike - Love the chart - Each spike brings back a memory of a “deep” winter. And it proves my theory that there is no such thing as a “normal winter”!!
Neat link too - love the old photos!
This reminds me - I better get my “snow board” out and ready to measure snow this winter - it is an honor to be part of the NOAA weather spotter team. Last winter I needed a yardstick to measure snow, but the winter before a 12″ ruler was sufficient.
The secret to “snow water equivalent” measurement is to weigh the snow. Take a piece of plastic pipe and weigh it. Then drive it into the snow and weigh the packed pipe. Subtract the first weight from the second and you have the weight of the snow.
Fill the pipe with water and weigh that. Divide by the length of the pipe in inches. That will give you weight of an inch of water in the pipe.
Divide the weight of the snow by the weight per inch of water. That gives you the snow-water-equivalent in inches. Voila’ Eureka!
by climatron
Interesting analysis. What seems strange is that you picked mostly high elevation sites where it is known that the trend is less. Low elevation snow is what is vulnerable to temperature effects, so if you were wanting to find the meaningful trend (or prove a true non trend) that’s where you’d look.
Of the 352 stations in the NRCS snow database that are in Idaho, 50% of them have an elevation below 6500 feet. However, only 3 of your 20 stations (15%, tremewan ranch, moores creek and tony grove) are below 6500 feet. The average of NRCS stations in Idaho is 6378 feet, the average of your subset of data is close to 1000 feet higher.
All in all, the analysis reads a bit like a patient saying their leg is broken and the doctor countering that there’s nothing to worry about, their arm is fine. Of course, just the way the network was built, low elevation sites were not popular back in the 1930s, so it’s understandable why you may have gravitated to a high elevation set. I’d encourage you to maybe repeat the analysis though with your 3 low elevation stations only and see how it’s different. There’s other low elevation stations you might include.
Thank you for the comments, climatron.
I selected the sites based on years of continuous measurement. It is happenstance that they are high elevation. Of course, that’s where the snow is and why those sites were deemed important to measure from the beginning of snow surveying.
Low elevation sites have less snow, in some years only a trace or none at all. And even in the heaviest years, low elevation sites have very few inches in snow water equivalent.
So without doing the analysis, we can safely assume that the low elevation sites will reveal nothing. The record will have many zeros and small values in most years.
I also question your assumption that low elevation sites are most vulnerable to temperature effects. Global warming is (allegedly) a global, whole atmosphere phenomenon. The effects, if any, should be discernible at all elevations. The predictions of GW alarmists are for long-term drought. There has been significant discussion and controversy about snowpack, and declining snowpack is allegedly the harbinger of GW.
I have shown that snowpack has not changed over the last 75 years in the Snake River watershed. The contribution of low elevation sites to snowpack is nil. The snow is on high, and the snowpack has not changed.
Amazing. After four years of hard-nosed, public debate about snowpack, in which the western governors and the Washington State climatologist have issued dire report after dire report about declining snowpack, after the force-out of the Oregon State climatologist for refusing to knuckle under to the snowpack alarmists, after the firing of the assistant Wa State Climatologist over this very issue, now we come to find out that “it is well-known that there is no trend in snowpack at high elevations” (cit. climatron above).
Hey climatron, if that was so well-known, maybe some good folks should get their jobs back!
The fact is the Chicken Little Sky Is Falling GW alarmists have been on the warpath, firing blindly, ruining careers, politically tampering with science and research, on an absolute frenzy over GW. Now, when it is shown that their politically-biased pseudo-science theories are dumkoften, they suddenly claim they “knew it all along.”
It was all a joke. They didn’t really think there was any change in snowpack. They didn’t really mean to cost good people, honest and capable people, their jobs. It was all for show, just political theater, something to get the blood up in the masses, a political trick, nothing real. They knew all along that their whole snowpack line of bull was bull.
Sorry, climatron. I don’t buy the new line anymore than I bought the old line. Global warming is a hoax, was a hoax, will be a hoax, and there is no other way to cut that cheese.
by nofreewind
Mike: The predictions of GW alarmists are for long-term drought. There has been significant discussion and controversy about snowpack, and declining snowpack is allegedly the harbinger of GW.
As you know, this winter some of the US had heavy snows and that prompted the Alarmists to change their tune, they are now predicting heavy snows [here].
Reply: No trend up or down. All predictions that the climate will change, somehow, must be predicated on past experience. And past experience is no trend either way. The alleged crisis has not materialized, despite the vast Alarmist rhetoric otherwise.
btw, Glenn’s site, NoFreeWind [here] is an excellent source of factual information regarding wind power. Along with some rhetoric, which we all succumb to on occasion and sometimes even enjoy.

In 2006, “the centennial year of the study of snow,” the National Water and Climate Center posted “the fascinating history of this remarkable program, including stories and pictures of actual surveys, helicopter accidents, avalanches, moose attacks, economic analyses, floods, droughts, saving the farm and even death. We hope that you are educated as well as thoroughly entertained by our history, the current program and our passion for all things Snow and Water.”
A library of great documents and historical photos pertaining to snow surveys was accumulated [here].